04Deregulation makes improving bus services harder for mayors
Deregulation in 1986 broke the link between cities and bus operators (see Box 1) and removed the powers and weakened incentives to support bus services. Cities lost control of the routes, frequencies and quality of the network, the setting and collection of fares, and the ability to use fare revenues and subsidy to fund the wider network. Integration with other municipal public transport modes was weakened.
The net result is that a vital piece of urban infrastructure is not regulated by the cities that rely upon it, and operators are often ‘out of the room’ when decisions are made that affect them. Only the small number of cities that have retained ownership of municipal bus companies can be fully confident that the vision and incentives of the bus operators will be aligned with those of the city council.22
The next section looks at the long-running problems with local bus markets that the 1985 Transport Act created.
Box 1: History of bus regulation in the UK
Pre-1985
Under the Road Traffic Act 1930, bus services were licensed by regional commissioners who set the quality standards for vehicles and drivers and regulated routes, frequencies and fares. These licences provided local monopolies to predominantly local and publicly-owned operators in major cities that used cross-subsidy to support an extensive and affordable network. From the 1950s, local authorities increased funding to municipal operators to keep fares low and maintain service levels in the face of rising car ownership and use.23
Transport Act 1985
Bus services outside London were deregulated in 1986 to open markets up to competition from any private operator meeting minimum safety standards. They had only to register that they would provide a service rather than hold the licence to do so. Local authorities were no longer allowed to subsidise fares. National government privatised its national and local bus operations, and local authorities were able to sell off municipal bus companies. Locally, authorities could only fund concessionary fares and tender for services that private operators did not provide. Around the same time, London was required to move to a locally-run franchising system.
Transport Act 2000
Cities and local bus operators have been able to form voluntary and statutory Quality Partnership Schemes to increase co-ordination to improve local bus services and increase patronage. Improvements to bus station facilities or bus lanes or marketing are provided by cities in exchange for new buses or higher driver standards delivered by operators. Quality Contract Schemes that enabled franchising were included in the Act but legal barriers for cities to introduce them proved to be too high.
Bus Services Act 2017
Franchising powers are made easier to access for metro mayors in England. Enhanced Partnership Schemes that go further than Quality Partnership schemes are made available to all cities. Other provisions about open data on fares and timetables to improve information for passengers are included.
What’s the problem with how bus networks operate?
Deregulation opened up problems in local bus services that were absent before:
Levels of cross-subsidy between profitable and loss-making routes have reduced and weakened bus networks. Cities can no longer use revenues from profitable routes to subsidise unprofitable routes in order to support a comprehensive city-wide bus network. Cities must directly support unprofitable services that private operators stop running, such as those early in the morning or at weekends. Some of the cross-subsidy that would support a more extensive, efficient and equitable bus network leaves the system as dividends to shareholders of private bus companies.
Bus markets are now local private monopolies. In reality, removing the regulatory barrier for operators to enter any local bus market in 1986 has failed to materialise into competition for most passengers in 2019. The market has consolidated into five major operators controlling 70 per cent of the national bus market with little overlap or competition between them. Their ‘core territories’, covering entire cities as in the West Midlands or Brighton, or large parts of them as in Greater Manchester, are largely ‘no-go’ areas for other operators.24 Without market regulation by cities or government, these local monopolies give existing operators the market power to set higher prices for passengers and provide a worse quality bus service for many residents away from profitable routes.
The potential for new operators to compete for passengers outside of London is in practice limited because challengers know that dominant existing operators will respond to competition by temporarily improving services or reducing fares to drive new entrants out of the market. Prices and service levels return to their original level once competition has been removed, outweighing the brief benefits to passengers. This dynamic of sporadic but fierce competition to protect or win monopolies was common in the years after deregulation in what were known sometimes called ‘bus wars’.25 These help to explain the short-lived growth in the bus network in that time.26 But these bursts of competition have declined, along with the network mileage and the benefits for passengers this brings, as the market has consolidated and operators’ core territories and responses to competition have become clear.27
Operators in London, where there is competition to run routes, run services on a lower profit margin than they do elsewhere in the country where markets are largely monopolies (see Case Study 1).The Mayor of London is able to invest the money saved into the network.
Case study 1: Competition, revenue risk and profit margins in London
In London, operators cannot deter competition with a short burst of unsustainable lower fares and higher frequency services for passengers which quickly disappear when the challenger withdraws. Franchising means that operators compete with one another in the boardroom in advance of providing services across the length of a contract with Transport for London (TfL). When each contract ends, competition is reopened to multiple operators. Due to scale of the market in London and the clear framework for operators to compete, London has the widest range of large bus operators of any city in the UK — other cities have more operators, but most are very small — attracting investment from around the world (one of the aims of deregulation was to encourage investment by the private sector into buses). Many of these firms are present in London but nowhere else in the country.
More effective competition for every route means that operators generate lower profit margins in London than they do elsewhere in the country. TfL takes on the revenue risk of running bus services by collecting the fares and paying operators a fixed fee. Operators have greater certainty about their returns over the course of the contract and accept a lower margin for lower risk. The introduction of franchising would let mayors elsewhere drive down profit margins to make more efficient use of fare revenues and public subsidy to procure a better bus service.
Duplication has developed on the most profitable routes. In the limited areas where networks overlap and routes have an extremely high density of potential customers, such as Manchester’s Oxford Road, competition can be sustained. Passengers at bus stops value convenience, i.e. the first bus that turns up, so the focus of operators is to run as many services as possible on these routes to be the first bus.28 It also brings down fares. But this can create ‘overbussing’, when the capacity and frequency of services exceeds that needed to satisfy demand so buses are emptier. It creates higher levels of traffic, greenhouse gas emissions and worse air quality. This duplication initially saw bus networks expand after deregulation but they have since declined, while in London the network has continued to grow.
Integrated transport has become more difficult. The main competitor for public transport should be the car. But deregulation has left private bus operators in competition not just with cars but with one another and with other public transport modes. This reduces the efficiency of the public transport system because of duplication, and diminishes the quality of the public transport offer without integrated and co-ordinated marketing, ticketing, pricing, timetables and routes.
Metro mayors are responsible for improving local transport and already control some public transport services, for example local rail in Liverpool City Region, and light rail in the West Midlands and Greater Manchester. Integrating deregulated bus services into these networks when they have different incentives, organisational structures and finances is difficult.
Mayors and private bus operators are in competition for fares on the network, and this will only increase as light rail networks expand as planned and if rail devolution takes place. The potential to use revenues from light rail to cross-subsidise buses and adapt bus routes to make greater use of new rail links, as London did at the launch of the Night Tube, is not possible under deregulation.29
Case study 2: Competition in Tyne and Wear
Source: Department for Transport, LRT0101
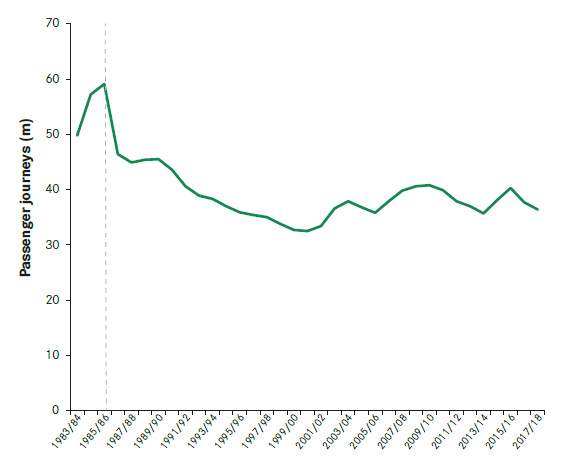
Ridership on the Tyne and Wear Metro dropped by 13 million – more than 27 per cent – in the first year of bus deregulation when bus operators competed with the light rail system, rather than complement it. As a result, ever since Tyne and Wear local authorities and national government have been paying twice for higher subsidy to support the Metro (as well as higher levels of Bus Service Operators Grant, a fuel subsidy to support bus operators) to provide overlapping and competing services.
Figure 3: Tyne and Wear Metro ridership 1983 – 2018
Why don’t cities do more to support local bus operators?
The problems caused by the deregulation of bus services are not limited to how they change the incentives and actions of bus operators. The incentives for cities to fix these problems, especially around increasing the monetary and time cost of car travel relative to bus travel, have also been weakened by deregulation.
Lack of control of bus services has led to less investment in bus priority schemes by cities despite growing congestion. More cars on the road have increased congestion. Every extra kilometre driven by car generates 17p of societal harm because of congestion.30 Bus speeds have slowed by around 1 per cent per year for five decades — a 10 per cent drop in journey time is associated with a 10 per cent drop in passenger numbers.31
Because cities do not have control over bus services they have done less to address the problems of growing car-based congestion and falling bus ridership. Cities are only indirectly exposed to the decline in ridership and farebox revenue this causes, reducing the incentive to insulate buses from congestion.
Cities have been reluctant to take major action to increase the costs of driving into congested areas — such as a congestion charge — without certainty about how bus services will respond. For example, a congestion charge for cars in Birmingham could significantly improve margins and revenues for bus operators. Once bus priority schemes are introduced, cities have no leverage to encourage operators to invest gains back in the network, making the political case to the public for the initial action more difficult.
In London and Nottingham, local bus routes, fares, frequencies and quality are both set in order to maximise the quality of the overall public transport offer. The Mayor of London does this directly. In Nottingham the bus company that operates most local services is 86 per cent owned by the city but run at arms-length from the council.32 City leaders can be certain about how the operator will respond to policy changes because the board comprises councillors and other civic representatives.
These are the only two large cities where this is the case, and also the only two cities that have introduced higher charges for cars, explicitly linking improvements to buses to the charge.33 It is striking that these measures are available to leaders in all other big cities, but they have not been taken up.
Case study 3: How Nottingham has made ambitious policy moves to improve bus services
Source: Department for Transport, BUS0109
In Nottingham, if buses become caught in traffic and passengers switch to another mode or stop travelling, this has an immediate financial impact on the municipally-owned bus operator and therefore the local authority. Nottingham has some of the most advanced bus priority measures to maintain speeds and journey time reliability:
Charging car commuters. Nottingham is the only city to have introduced a Workplace Parking Levy — a £415 annual charge for each parking space on businesses (except retail) with more than 10 parking spaces. This encourages car commuters to use alternative means, reducing traffic levels that allow bus services to run more reliably and subsidises extra bus services.
Bus lanes. In Nottingham the main routes into the city which become congested at peak times have bus lanes. On one route at rush hour, buses make up just 5 per cent of the traffic but 48 per cent of the people.34
The city’s bus patronage has remained stable even as bus ridership has fallen elsewhere in the country (see Figure 4) and while it has expanded its tram network. In other cities such as Greater Manchester, growth in tram ridership has reduced bus patronage.
Figure 4: Change in bus passenger numbers in metropolitan areas and Nottingham

Lack of control and public accountability for bus services has led many cities not to protect funding. An efficient bus system that lets residents choose to minimise the use of their cars will require subsidy. Falling funding to local government has left supported bus services exposed to cuts in the face of decisions about whether to fund other vital services such as social care. Funding for supported services by local government outside of London has fallen by 43 per cent over the past decade, funding fewer services.35 Greater Manchester and Liverpool City Region’s franchising proposals both include an increase in funding for services.36
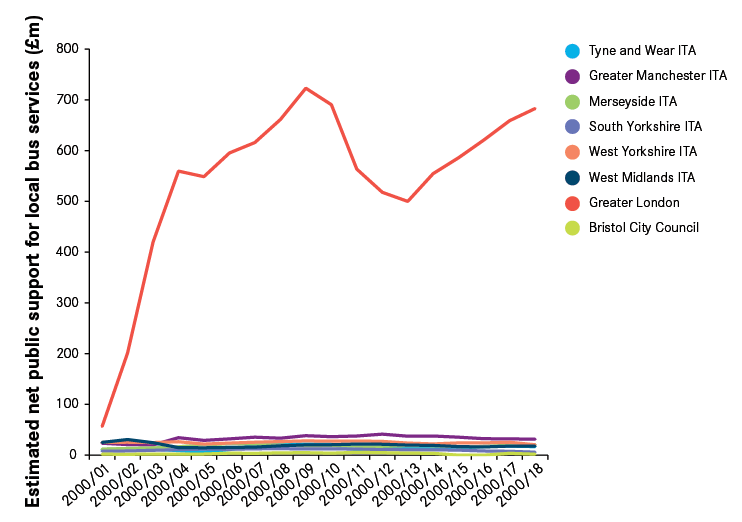
In London, the introduction of the Mayor of London with control and acountability for the buses in 2000 led to a dramatic increase in funding for the network (see Figure 5) that has supported the network’s growth and delivered the benefits of higher bus ridership. Despite austerity, this subsidy has remained high while it has fallen elsewhere, in part because the Mayor of London has complete control over what the subsidy is used for. This includes direct subsidies to adult fares and more extensive concessionary schemes than elsewhere in the country.
Higher subsidy has been used to support a fares freeze since 2016 of £1.50 for a single ticket (and extra journeys within an hour made free with a new Hopper fare) and £4.50 for a day ticket. A 10 per cent real-terms increase in fares is estimated to lead to an 8 per cent drop in journeys.37 Since 1999, bus fares in the capital have grown by 40 per cent in real terms, fares in metropolitan areas by 71 per cent and in the rest of England by
50 per cent.38
Figure 5: Estimated net public support for local bus services (£m)